
Physics classrooms feel lively as ideas spring to life through sketches. The hum of a projector and students debating vectors show why a reliable visual scaffold helps learning. A simple tool like grid paper makes ideas tangible from the first sketch to the final diagram.
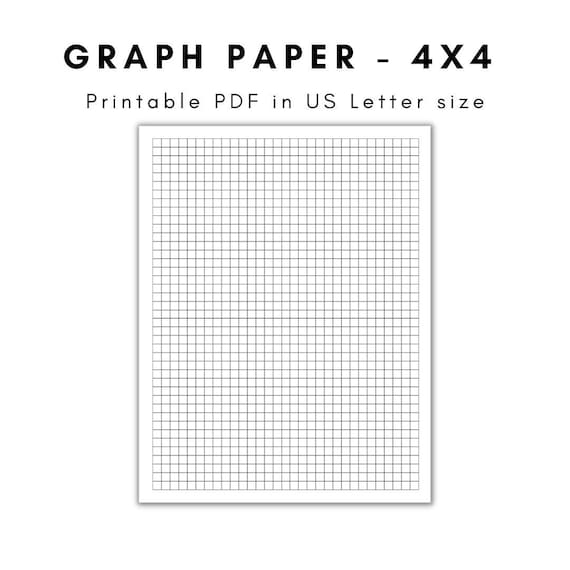
Students learn best when visuals stay consistent. On every lab, I pair explanations with precise, repeatable sketches on 4×4 graph paper. The tight 4-by-4 grid forces careful spacing, keeps axes aligned, and makes unit conversions and slope estimates clearer as data accumulates. That consistency saves time during labs and reduces excuses when results differ.
Why grid paper matters
In physics, a good grid is a measurement grid you can trust. I use it for plotting velocity versus time, recording forces, or sketching circuit diagrams. A square grid helps students visualize slopes as ratios, recognize when a line represents a constant acceleration, and compare results with theoretical predictions. It also teaches careful labeling of units and scales, which is essential for reproducible experiments.
Grid size options
For many classroom tasks, a balance between readability and precision is best. A 4×4 or 5×5 grid on standard letter paper gives room for labeled axes, units, and brief notes. Consider grid spacing (the distance of each square) and the margins so you don’t lose data near the edge. If students sketch large values, a larger grid may help.
Plan the sketch before you plot. In a typical lesson, students outline axes, choose units, then draft a rough curve on the grid paper. That planning step reduces rework and helps students check scaling, orientation, and whether their marks stay within the printable area. After the draft, they refine labels, calculate slope mentally, and compare the grid spacing to the actual measurement tools they will use in experiments.
Printing and setup
FAQ Q1: How does grid size affect measurement precision in a lab sketch? A1: A finer grid allows more precise plotting and smoother curves, but it can crowd the page if the data are dense. Q2: Should I print at 1:1 scale for accuracy? A2: Yes, aim for 1:1 so each square corresponds to your chosen unit.
FAQ Q3: What about orientation and margins for readability? A3: Portrait orientation often works well for vertical graphs; landscape suits broad comparisons and wider labels. Q4: How can I ensure printing accuracy easily? A4: Print with 100% scale and check the margins with a ruler, adjusting in your browser or printer settings if needed.
In practice, the key is to pair clear targets with a reliable grid. Start with a consistent paper size and orientation, choose a square grid that fits the task, and confirm margins before you print. Use the grid to link theory and data, and keep a quick log of scale choices for future labs.