
As a geometry instructor, I start with a simple truth: slope field graph paper is a practical lens for understanding how differential equations unfold on a coordinate grid. It turns abstract slopes into a visual pattern students can read on paper. Use it as a classroom tool to clarify behavior, not just formulas.
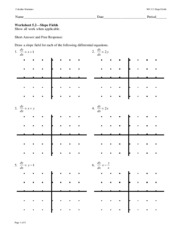
Using slope fields, you can compare nearby points to see how a solution behaves without solving the equation symbolically. The grid lines act as a reference, making it easier to estimate whether trajectories rise, fall, or level off. This visual approach supports intuition and reduces anxiety by turning formulas into a concrete pattern you can trace.
Grid size and formats
Plain paper, lined paper, and graph paper each serve different tasks. For plotting slope fields and vector grids, plain or lined paper often lacks consistent spacing, which can introduce drift in measured slopes. Graph or grid paper provides a square grid, margins for notes, and a stable reference frame. Printable grids are handy in class demonstrations, and the right choice depends on portability, cost, and how precise you need measurements to be.
Practical tips for grid paper include choosing a grid spacing that matches your typical diagram size. Common options range from 5 mm to 1 cm square grids. Smaller grids give finer detail but take more space; larger grids are quicker to sketch but offer less precision. Consider the paper size and orientation you plan to use to keep diagrams legible and proportional.
Printing and scale
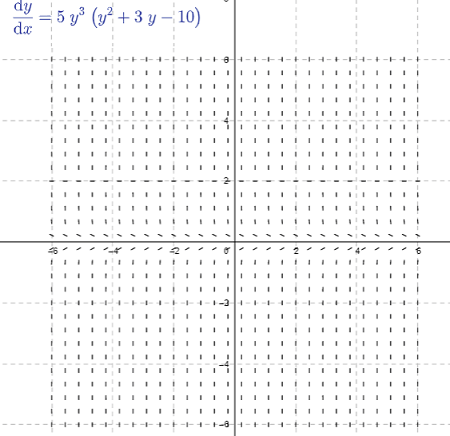
Printing scale and margins matter when accuracy is required. If you print a slope field, set the scale so one square on the grid corresponds to a fixed unit in your model. Check page margins before printing, and print a test page to verify grid alignment. Use the browser's print settings or your printer software to preserve aspect ratio.
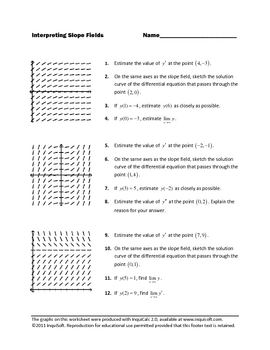
Comparing plain paper and lined paper for practical tasks, graph paper reduces measurement drift and keeps slopes aligned, but plain paper can be acceptable for quick sketches or off-page ideas. Lined paper can hinder precise grid plotting and misalign grids, while graph paper aids consistency. If you share diagrams with others, consider printed or labeled grids to avoid confusion.
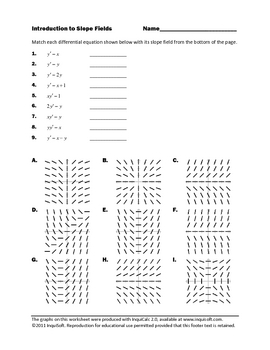
FAQ: Q1: How do I choose grid spacing for a new project? A: Start with 5 mm squares and adjust if your figures look crowded. Q2: Can I print slope fields at home, and what settings help accuracy? A: Yes—use a 100% scale, correct margins, and run a test page to confirm alignment. Q3: Is plain paper workable for teaching a quick concept review?
A: It works for rough drafts but graph-paper grids reduce drift during discussion. Q4: What should I check before sharing graphs with students? A: Confirm the grid orientation, margins, and scale match the intended model so the figures reproduce accurately. Conclusion: The practical takeaway is to select a grid size that matches your diagrams, print at a reliable scale, and keep consistent margins to support clear, reusable visuals.