
From the chalkboard to the lab bench, I rely on clear layouts to teach how physics plots reveal velocity and energy. In class, I provide printable graph paper free templates that keep lines straight and students focused on ideas, not formatting.
Having a reliable grid paper selection helps students translate data from sensors into accurate graphs. It also supports formative assessment, because clean axes and legible labels reduce errors during quick sketches. As a physics teacher, I model how to choose grid spacing and margins for neat handouts, then encourage students to adapt layouts for labs and project posters. This attention to layout also gives students a chance to practice good note-taking and data integrity for labs and peer review.
Planning with grids
In a typical class, I assign a warm-up where students plot distance vs time on coordinate grids. I guide them to select grid spacing that matches measurement precision. We discuss margins and scale, encouraging students to annotate axes clearly. The goal is to harmonize math, measurement, and physics intuition.
During lab planning, we discuss grid paper options ahead of time: portrait versus landscape, A4 versus letter, and whether to print with a 1 cm or 0.25 inch grid. We test drafts on screen and in a quick print, then compare how scale changes slope accuracy and label clarity. This practice helps students feel confident translating lab data into readable graphs. We also talk about poster-friendly layouts that preserve readability at a distance.
Sketching workflow
Sketching a projectile motion graph in class gives a concrete workflow. First, we organize a data table from measurement pins and timers. Next, we choose grid spacing and axis ranges that accommodate the data without crowding. Finally, we draft the graph with labeled axes and a clear scale, so peers can read the slope at a glance.
Choose grid size of 1 cm squares for most physics graphs. Use landscape orientation when data spans wide measurements or wide plots. Print at 100% scale to preserve line spacing and slope accuracy. Check margins and perform a quick print test on plain paper to verify alignment.
Accuracy checks
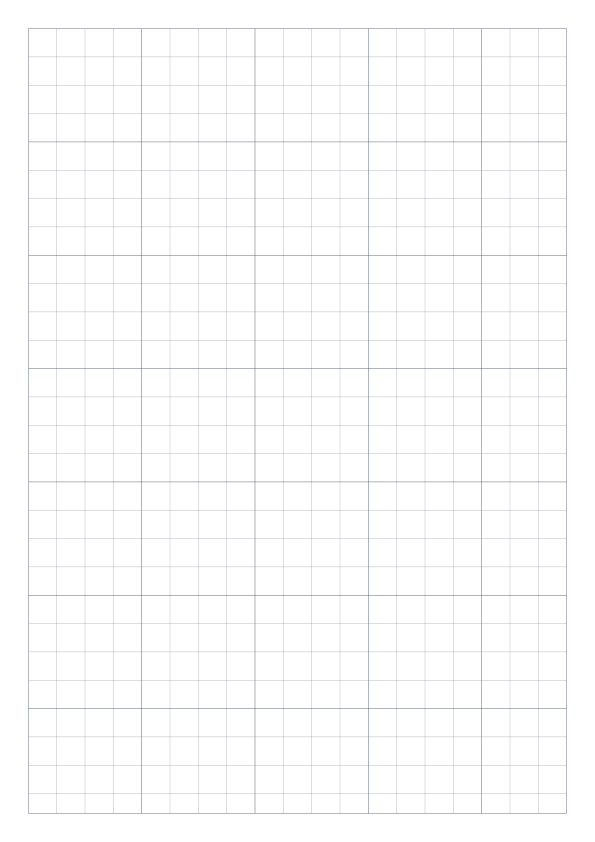
For accuracy, align your grid size with the task, and start with 1 cm squares for data plotting. Choose paper size (A4 or letter) based on your classroom printers and the intended audience. Portrait or landscape depends on data layout, with landscape often better for wide graphs. Always print a test page at 100% scale and measure critical distances with a ruler to catch drift.
Concluding takeaways: plan your grid thoughtfully, set the scale early, and test prints before distributing worksheets. A well-chosen grid improves accuracy, speeds up learning, and reduces frustration in lab notes and posters. With simple habits—appropriate paper size, margins, and clear axis labels—students gain confidence translating measurements into graphs that tell a physics story.