
As a geometry instructor, I appreciate how a well-prepared surface supports a lesson on polar coordinates. For students, polar graph paper helps keep angles and radii aligned, reducing confusion and making it easier to visualize how curves behave across quadrants.
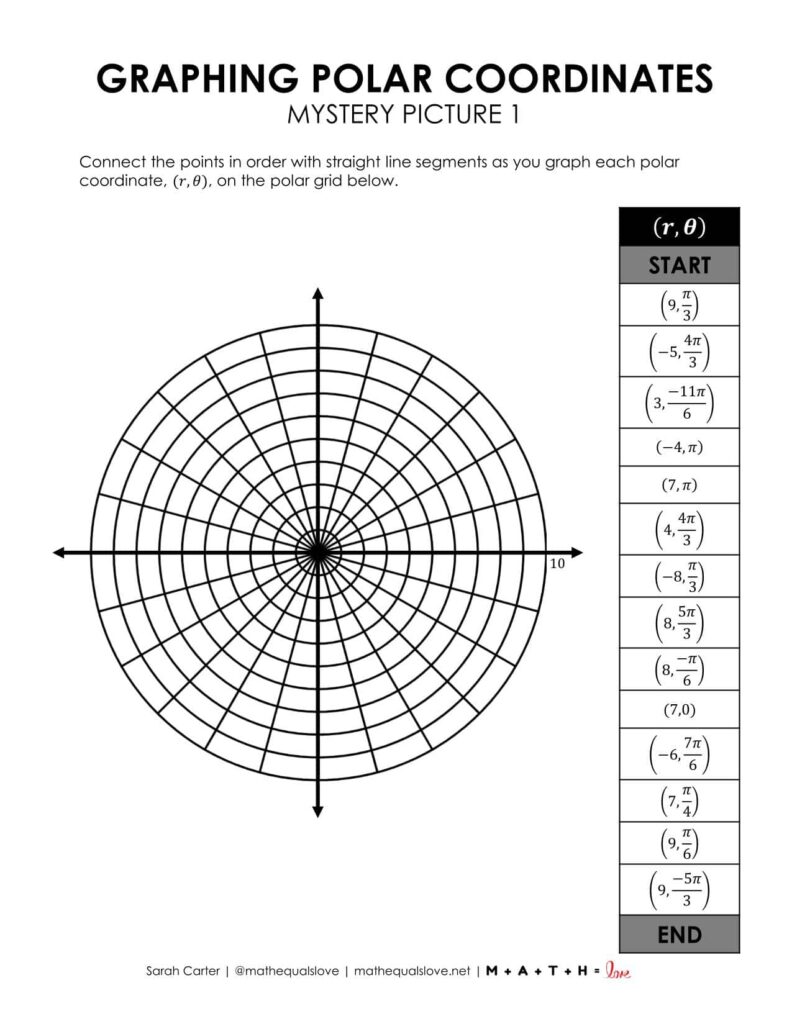
Polar graph paper is designed with concentric circles and radial lines, which makes it easier to plot points in polar form and study transformations. It helps students measure angles accurately from the pole and compare radial distances at different angles without constant redrawing. When you place a curve on this grid, symmetry and pattern become visible at a glance, which is invaluable for explaining how theta and r interact in familiar shapes.
Why this grid helps
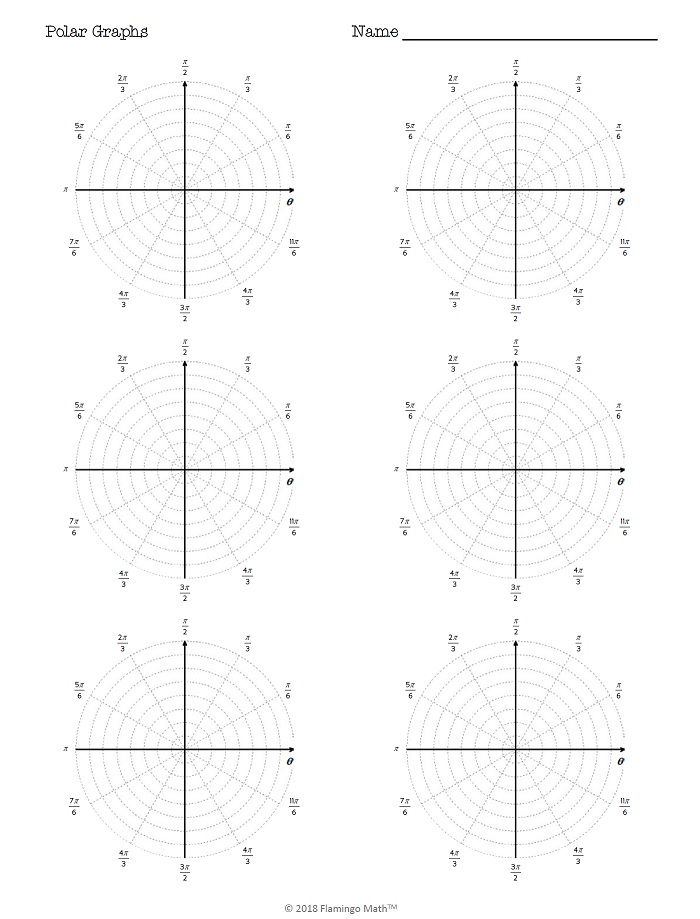
When you compare polar graph paper with plain paper or standard lined notebook pages, the difference is practical. Plain paper minimizes visual clutter, but you lose alignment aids that help measure angles and radii. Lined paper offers a sense of vertical scale but does not provide a polar structure, making it harder to annotate circular plots. For polar diagrams, the radial and circular guides cut down setup time and reduce measurement errors.
Choosing grid size
For most classroom tasks, a medium grid spacing of 1/4 inch (6 mm) works well for high school and introductory college work, offering enough detail without crowding the page. If you plan to plot many points or complex curves, a finer grid of 1/8 inch (3 mm) can improve precision. Conversely, larger grids simplify rough sketches and quick checks.
Practical usage tips
Checklist for setup helps students and instructors stay consistent. First, decide grid spacing and paper size. Second, set the print scale to match your grid. Third, check margins and run a test print. Finally, label key radii or angles on the page to reinforce coordinate grids.
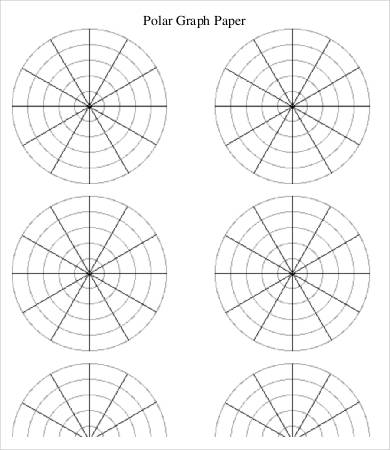
With the right grid size and a thoughtful layout, polar graph paper becomes a friendly teaching aid rather than a worksheet chore. Use it to scaffold lessons on symmetry, trigonometric relationships, and vector plots. When accuracy matters, check measurements and printing settings, and let the grid do the precision work so students focus on concepts.