
In my physics classroom, clean grids help students see the patterns behind data. The right graph paper makes plotting graphs easier and reduces setup mistakes. When ideas move from numbers to visuals, learners connect concepts like velocity, acceleration, and energy more quickly.
With practical experiment sheets and labeled axes, a quiet, consistent grid becomes a tool rather than a distraction. I favor printable a4 graph paper because it fits most classroom desks, allows quick copying, and keeps margins predictable for handouts. Students can focus on trend lines and measurement accuracy instead of wrestling with misaligned scales.
Planning and sketching
In a typical lesson, I outline the learning goals: data collection, graph interpretation, and predicting outcomes. We hand out grid sheets on A4 paper and ask students to set up a coordinate grid for a velocity experiment. We discuss margins and orientation so the plotted points stay legible on shared worksheets.
Grid Spacing and Scale Grid spacing matters for accuracy. A 5 mm square grid works well for velocity graphs, while a 1 cm grid suits larger diagrams. Mark axis units clearly and keep margins even. A consistent scale helps students compare data across groups and labs. Encourage students to annotate major grid lines. This practice builds confidence in measurements.
Grid size and paper orientation
When you prepare the print, choose Actual size in the browser and printer dialog to preserve scale. If you need larger graphs, use the print scaling option to fit to page without shrinking. Check margins before students start, and consider landscape orientation for wide data sets. For slower printers, print a test page to confirm alignment.
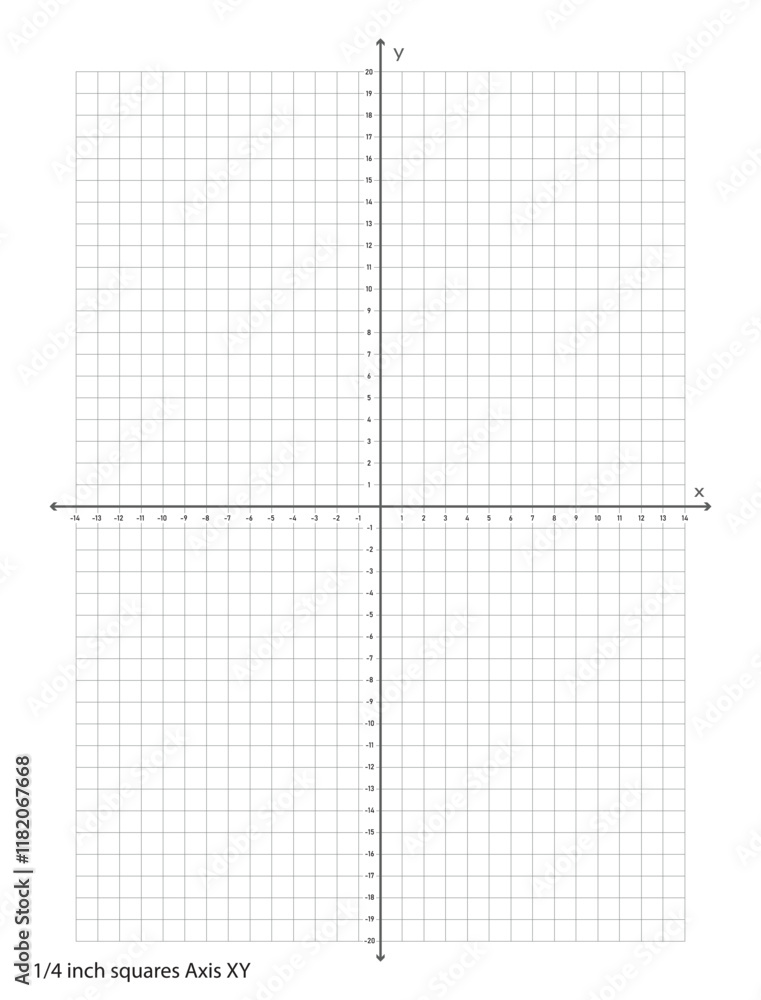
After printing, verify the measurements with a ruler on a sample graph. Students should be able to reproduce points within a small tolerance. Use light pencil marks to draw axes and grid lines if annotations are needed, and remind learners to record units and scales with the same precision used in the lab. This practice builds reliable data-handling habits.
FAQWhat grid size is best for beginners? A 5 mm grid works well for most plotting tasks.How do I print to scale accurately? Use Actual size or 100% in browser and printer settings.Which paper size should we use? A4 is standard for class handouts.How can I verify measurements? Have students compare plotted points to a ruler and discuss any deviations.Conclusion: Pick grids and margins that fit the activity and test the print before a lab.